Hello all Civitai users!
Let me first say, I still think the X/Y/Z plot script included with A1111 and Forge is a great feature. And I'm very thankful to whoever made it and put it in there in the first place! Having free, open software like this is not something I take for granted.
After working with it for quite some time however, I did feel a need for some additional functionality. For example the sub grids lack a Z label on them, and the main grid is always included (can't be deselected) and in horizontal shape.
So about a month ago I decided to make a modification which addresses all the wishes I could think of for improvement. The UI is pretty much self explaining, so I'll just post some screenshots and show you the main changes.
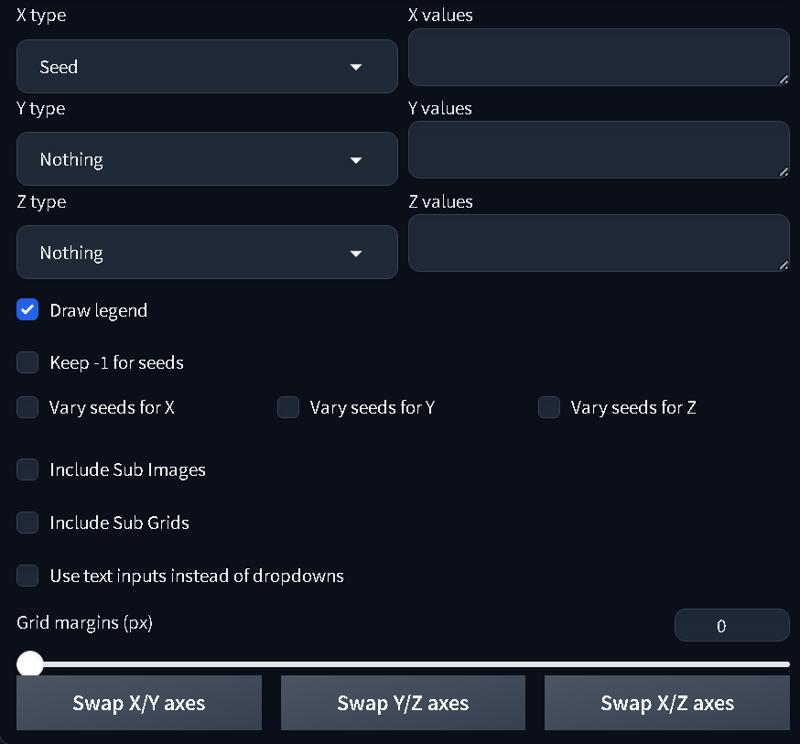
This is the UI of the original/default X/Y/Z plot:
And this is the UI of the modified X/Y/Z plot. The size is the same, but it uses the available space to include more user selectable options:
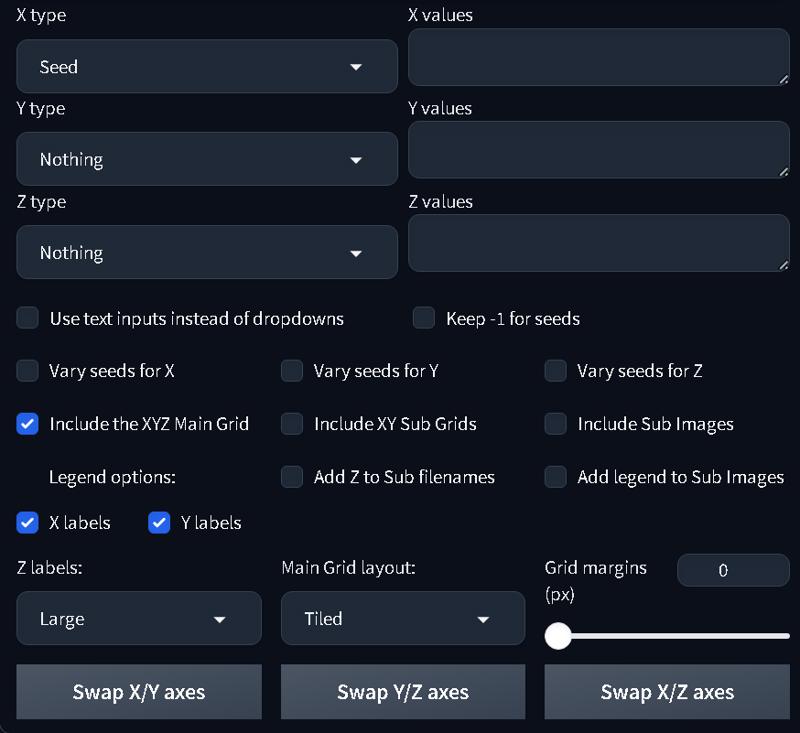
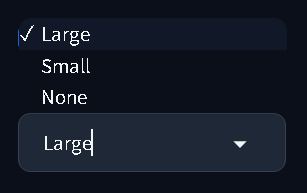
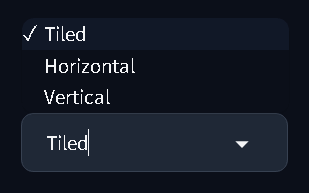
The modified UI also has two dropdown boxes (for the Z labels and Main Grid layout):
MAIN CHANGES:
- The Main Grid, Sub Grid and Sub Images are now all optional and selectable. Note: If you deselect the Main Grid, the check for max image size will recognize it and not prevent you from running the script due to the image becoming too big.
- The axis labels are now customizable. X-, Y- and Z-labels can be switched on or off independently to your own liking or need. The Z labels can be made small or large on the grids.
- The Main Grid can now be made in tiled, horizontal or vertical layout. (A1111 actually has built in support for this, but the XYZ script didn't take advantage of it. Now it does.)
- The script includes a new Main Grid algorithm and will understand when the main grid can be made with fewer labels, and thus produce a tighter looking grid.
- There is now an option to add a legend to Sub Images. (Note that there is no way the script can control font size, so I made it so their legend and labels will always be as small as possible).
- There is now an option to add the Z-label to the save filename for Sub Grids and Sub Images.
- I added a few extra confirmation messages which will be printed after generation and saving of grids/images.
EXAMPLE OUTPUT:
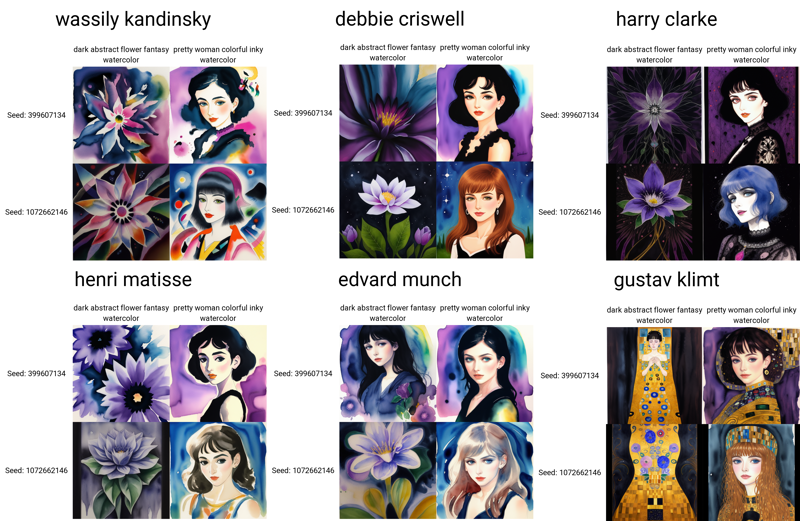
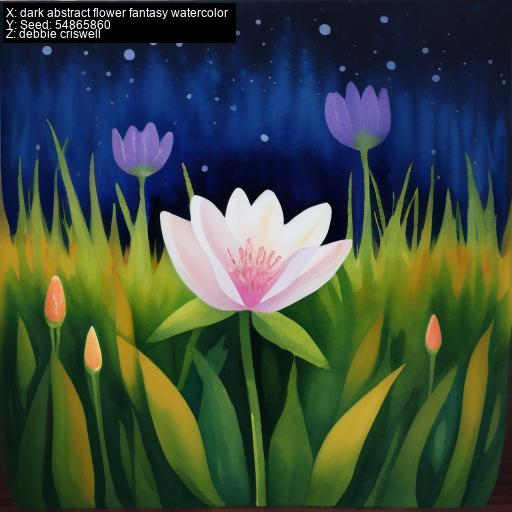
To give you a small sample of how the changed output may look like. Here is a grid of two prompts (X), two seeds (Y) and six different art styles added to the prompts with "Prompt S/R" (Z). In the original script the main grid will typically look like this:
https://i.imgur.com/bA5LQeu.jpg
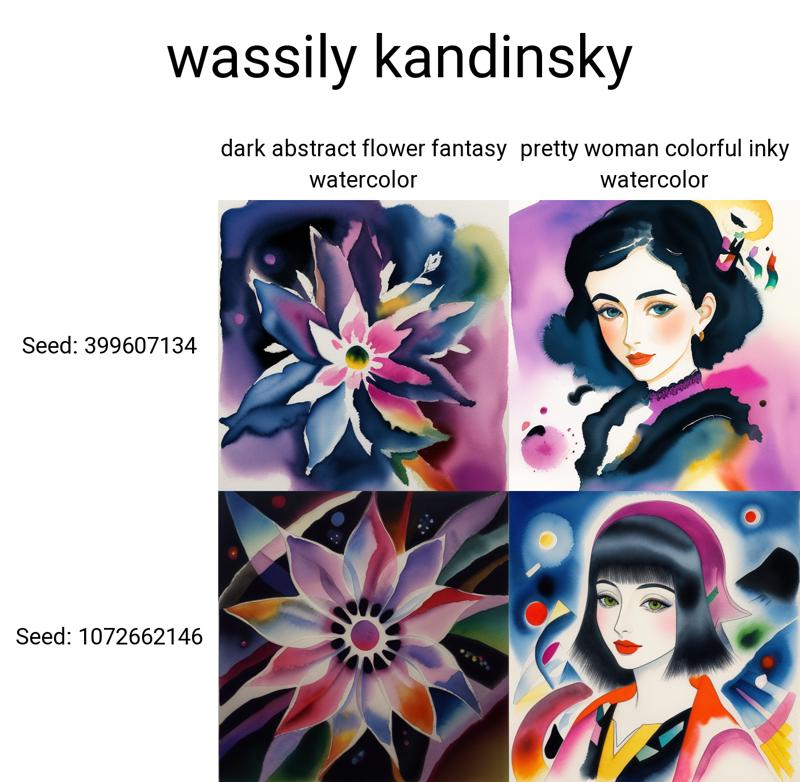
And the Sub Grids and Sub Images like this:

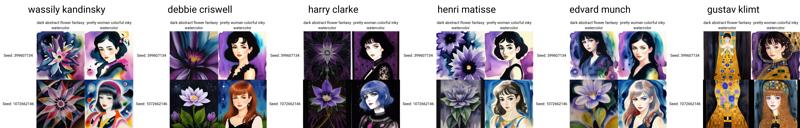
In the modified script, the Main Grid can be made as either "Tiled", "Horizontal" or "Vertical". In this case "Tiled" will fit better on a screen and look like this:
https://i.imgur.com/eLZ1Hvn.jpg
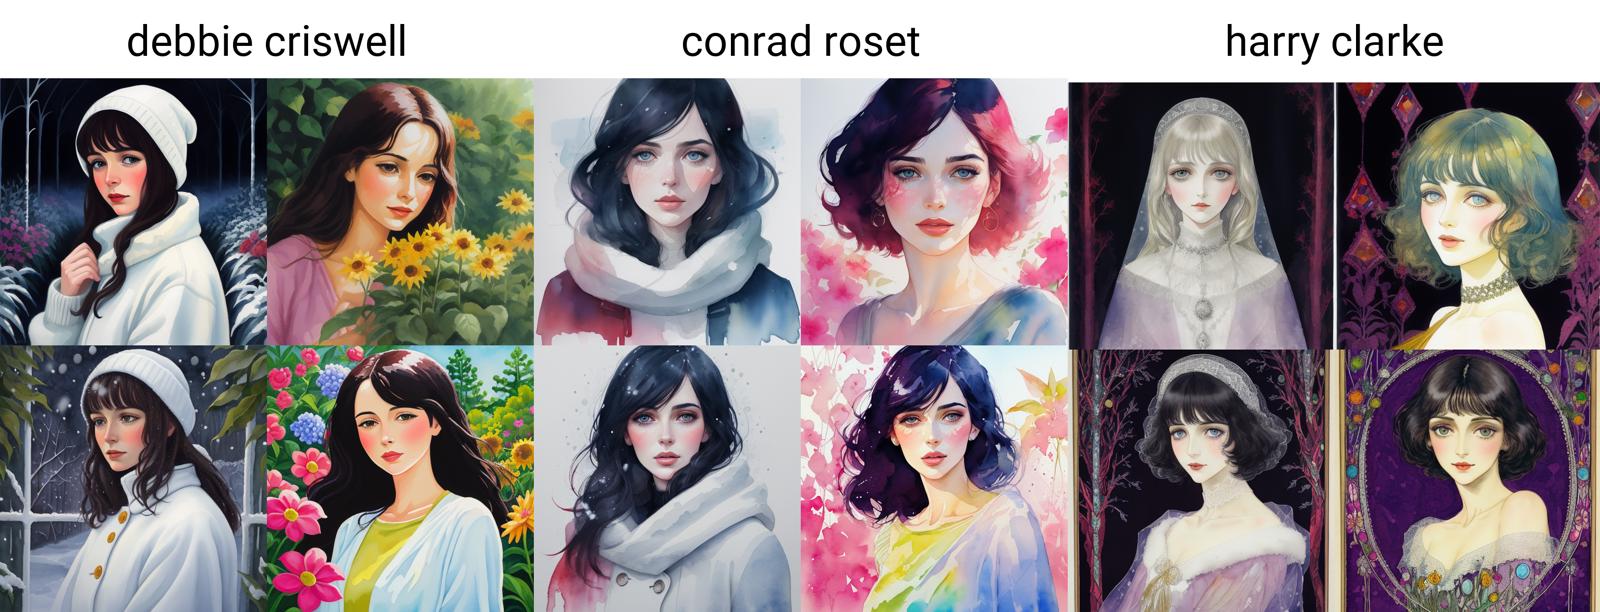
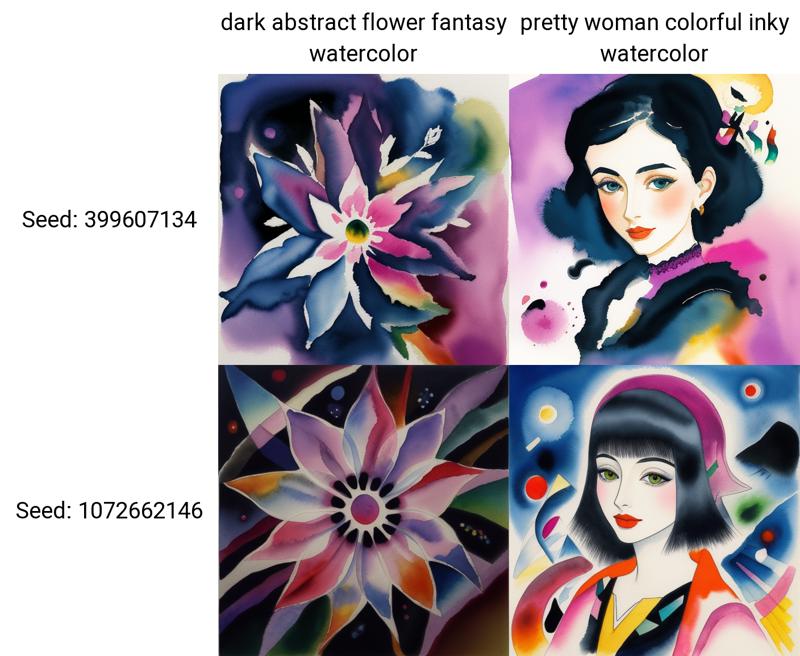
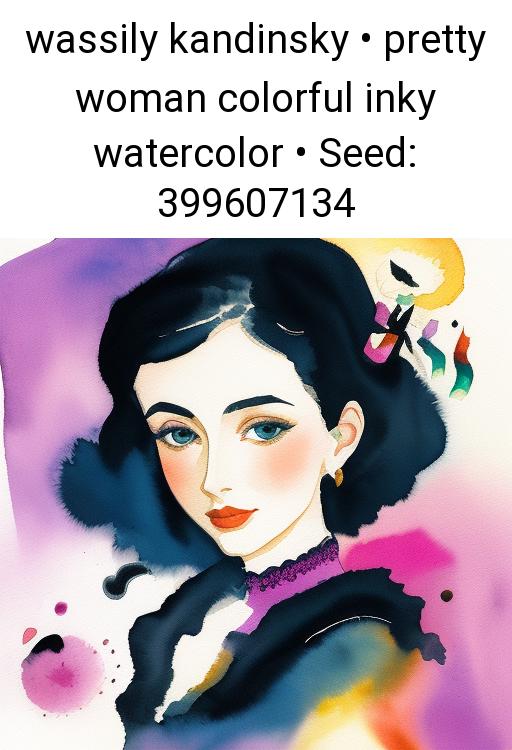
The Sub Grids will include the same user selected labels as the Main Grid. The Sub Images will too if you have checked for "Add legend to Sub Images" (in other words it can be completely switched off independently of what you choose for the grids):
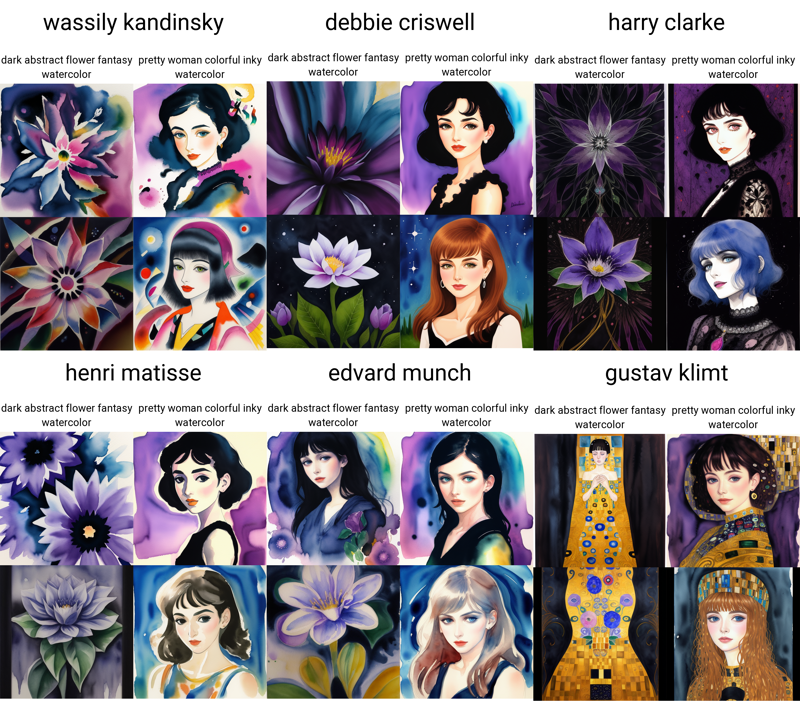
There's many possibilities for customizing the output. I may decide that in this example case the seeds are not particularly interesting to add to the grids, and they take up a lot of space. So I can simply deselect "Y" in the legend options, and the Main Grid will instead look more compact. (Similar changes may happen automatically if the script finds it possible to do, for example if you don't include Z labels the Main Grid will change and look similar to a regular XY plot):
https://i.imgur.com/ofy6Yu5.jpg
Again the Sub Grids and Sub Images will follow the same labelling. Note that the Y labels (seeds) are now gone:

There are many ways you can combine the options. For example I often like to use wide landscape image ratios, for this a vertical grid layout may be useful. I also know people use this script in many different ways, some even use it primarily to generate a large variety of single (Sub) images! So feel free to experiment :-)
DISCLAIMER:
I have tested it quite a lot, and to my knowledge there are no major bugs left in the code. Although I cannot guarantee it. "Use at your own risk" as people often say. But the code is there for anyone to see. (Note to the official maintainers or any other python competent people: I have clearly marked with dashed lines and "modified by Ori77" all the places in the code where I have changed anything. And put in a lot of explanation text. So it should be possible to understand what I have done)
HOW TO INSTALL AND USE:
To use it, you can simply place the script file in the A1111 or Forge "scripts" folder alongside the original/default "xyz_grid" python script file (you don't have to delete the old script file - you can select which version to use from the "Script" dropdown menu inside the client). I have attached python script versions for A1111 and Forge to the right side of this post, please choose the file for the client you like to use.
Also note that in the A1111/Forge client you should check for "Do not save grids consisting of one picture" in the "Settings" under "Saving Images/Grids". This is because if you don't, A1111/Forge will save all single images regardless of what you choose in the X/Y/Z plot UI. But with this checked, you can control everything with the script UI! I personally also like to check for "Always save all generated image grids", but this is up to you.
I hope someone will find this useful. I made it mostly for my own use, but spent a lot of time and effort on it so I wanted to share it in case it can be helpful for others as well.
Merry christmas!
Updated 31. december 2024 to version 1.1
Changes:
- Fixed a minor bug which in some cases could cause sub grids to be made when not called for.
- Added support for ReForge (see new script file in the attachements)
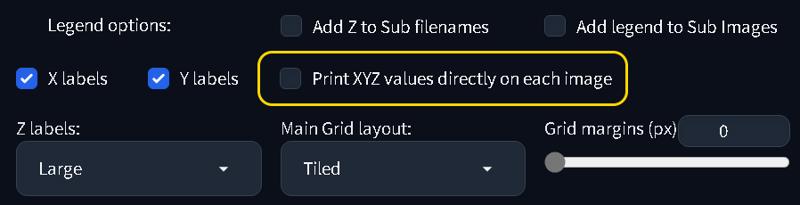
- Adopted a function from ReForge which can print XYZ values directly on the images.
About the last change, ReForge apparently tried to solve some of the same tasks as I did with this mod, but in a different way. I earlier mentioned the lack of font size control for sub image labeling, but ReForge got around that by adding it's own label drawing function! It does a similar thing as my existing "Add legend to sub images" option, but with the difference that it's printed on the image itself - not on an added legend. It can also print much smaller text. I made it slightly smaller than in the default ReForge script, but also added dynamic font size adjustment and cleaned up the look a little. Sub images can now look like this if you check the new option:
And this is where the new checkbox is located in the UI. Note that it affects ALL images, also those which are tiled inside grids (in contrast to the "Add legend to sub images" option):