
I read the article here: https://nsk.sh/posts/an-analysis-of-danbooru-tags-and-metadata/#post-scores-with-tag-count. I saw this:
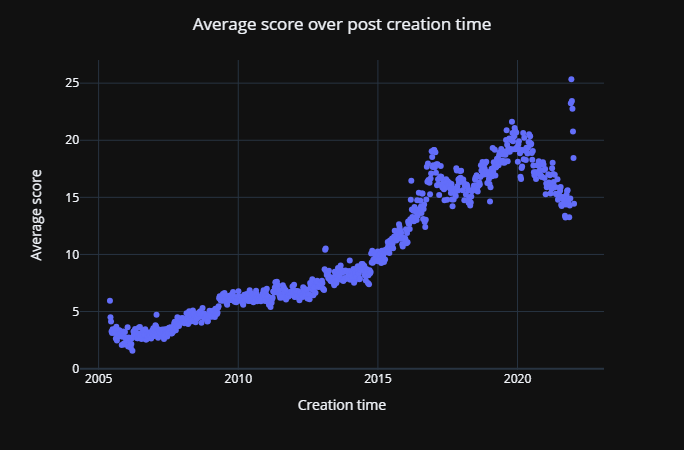
And I am quite interesting about the number of tags (especially the sudden drop of them at right-hand size of the plot in the article), since this is related to one question is that:
how many month after a image is created, its tag counts being stable.
This question is important, since tags will be added to each image over times, then when these images have all tags? (assume after enough time, all reasonble tags will be added to each image.)
data: https://huggingface.co/datasets/trojblue/danbooru2025-metadata
filtering out any samples that is not valid. I consider banned and deleted images to be not valid, since they is not reachable for most users on danbooru.
Then, I think there is a need to do some subgroup. Since the resolution of images should be a key factor that influence the number of tags them have. For example, a 500 * 500 low-res image is too blurry to have items being recognized by human eyes.
So, I divided all images into groups. (which is inspired by danbooru metatags)
For an image with height h and width w:
If h is None or w is None, then the image size is "unknown".
Else if h > 10000 OR w > 10000, then the image size is "incredibly_absurdres".
Else if h >= 3200 and w >= 2400, then the image size is "absurdres".
Else if h >= 1600 and w >= , then the image size is "highres".
Else if h > 500 and w > 500, then the image gets no resolution tag ("no_resolution_tag"), meaning it's considered normal or medium resolution?
Otherwise, the image is "lowres".
After subgrouping, I do a count and get the final plot of tags counts (general tag only) vs creat time. Here, I use general tag only, since for character tag or artist tag, it is easy to tag and I think it does not need further tagging after created.
The final result is like this:
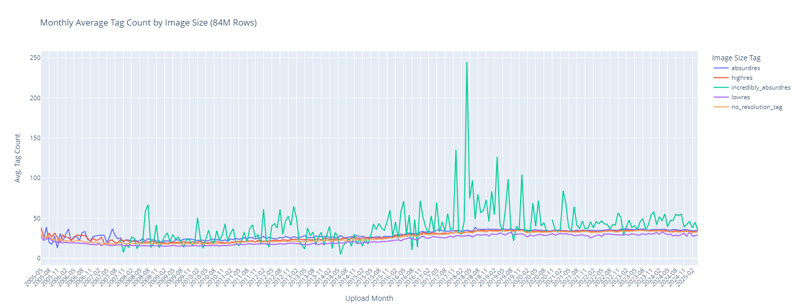
We can see that truly, the resolution has large difference for ones with incredibly_absurdres.
If we remove that, and go on.
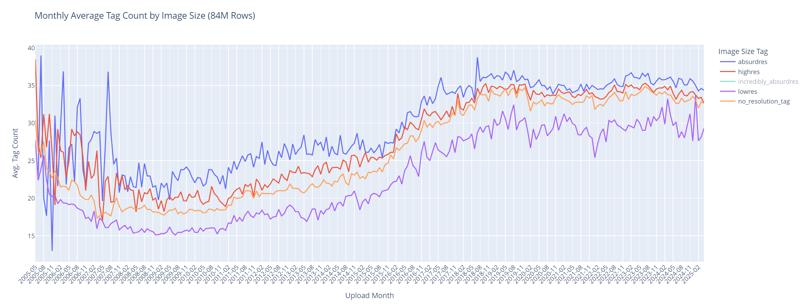
Thing become interesting. As we can expect, the low-res images have less general tags. But, the difference is small once go over 500 500 resolutions. Possible explanation is that most people may view images with thumbnails over between 500 * 500 and 1600 * 1200.
Most important, back to the starting point question:
how many month after a image is created, its general tag counts being stable?
I think the analysis I do gives the answer is that possibly lower than 1 month.
What about using daily data?
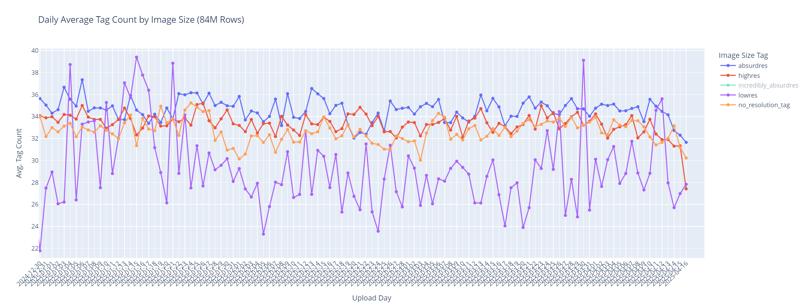
Here, we finally can see some similar trend at the end of plot.
But, the difference is too small (so, hard to say something very useful), and the drop of tag count is only in around 7 days.
7 days after a image is created, its tag counts is probably stable. (And no large difference between when it is created and after 7 days, for average, at most adding 10+ general tags.)
😂 Ok, after so many assumption and approximation, we get to an end that is not so mush fun.
I think why it is around 7 days, maybe after 7 days the viewing counts drops and that image can hardly reached by others.