There is an ever increasing number of models (checkpoint files) on Civitai (as well as mixes of models and mixes of mixes and so on...) And it's not easy to have an overview. The files are very large, and testing them takes a lot of time.
Because I'm curious, I wanted to explore possible methods to do it more effectively. So I did:
Examine how to most effectively test models with standardized prompts in the SD A1111 UI and save the outputs as named individual files.
Examine the use of python code to compare a large number of models, and save the data in a form readable with Excel. Then do an attempt at classifying the models with cluster analysis in RStudio from the Excel-data.
About point 1, I will post in another article (EDIT: Posted 30. august 2023 here: https://civitai.com/articles/2044/standardized-prompts-for-efficient-model-testing-a-possible-civitai-test ).
So this post is about point 2:
The tools I could find available was the "ASimilarityCalculator" by JosephusCheung:
https://huggingface.co/JosephusCheung/ASimilarityCalculatior
And the supermerger script for A1111 by hako-mikan (which includes an extended version of JosephusCheung's script and can output data for individual blocks):
https://github.com/hako-mikan/sd-webui-supermerger
(also available as an extension in A1111)
I first tried to extract as much data from the checkpoint files as I could, but found it difficult. The output was in JSON format, and I could not figure out how to parse or convert it all to a meaningful form for cluster analysis... (if anyone knows I would love to hear)
I then tested the "ASimilarityCalculator" script and managed to edit the script so it could compare every model file with every model file. This is Ok if you only have a moderate number of files. But imagine having 200... That is 40000 comparisons!
So to limit the number crunching a little, I got the idea of instead comparing the models indirectly. By selecting some models as "reference models" and then compare every model to only these reference models, the data will be much smaller but still contain a lot of information about which model is closer to which reference model etc. At least in theory...
Or so I thought.. I could again rework the python script to read from a textfile the list of models to compare against. But I found that the cluster analysis on the resulting data gave some strange classifications. And I guess it is because the ASimilarityCalculator only calculates the mean value (one single number) for each comparison. Two models can have very different results from the individual block comparisons, but still end up with the same average. So I needed a way to alter the script to output values for every block. I'm not a programmer, but with some help from chatGPT (to help me understand the python code) I was able to rework the code to include the relevant part of the supermerger script. And after that the results were much better!
I tested a few different ways of clustering the data, and found that Pearson's correlation measure (correlation based as opposed to the Euclidean distance measure) combined with the "Ward.D2" algorithm gave the most meaningful classes. This makes a lot of sense to me, I read that Pearson correlation is often used in genetics analysis for example. The point is that it looks at the patterns in the data variation rather than the magnitude. So even if a model is merged with some other model (diluted), the remaining properties from the original is more likely to be recognized (at least in theory from my very limited understanding of how SD models are structured and how merges work).
For the testing, I downloaded 100 of the most popular models on Civitai (for Stable Diffusion 1.5). I simply picked from top of the ranking lists for "month" and also "year" (to include also older well known models) and looked at both rating, most downloaded and most liked. Then also added some popular models on Huggingface (many of which seems to be old). Newer models and versions may have appeared during the 4 weeks it took to finish this.
As reference models, I tried to pick some unique and different ones. To make sure it would give the data more variability and information. The 18 models I used were:
(R1) v1-5-pruned-emaonly.safetensors (SD default model)
(R2) NovelAI-anime-full.ckpt
(R3) bb95FurryMix_v100.safetensors
(R4) gameIconInstitute_v30.safetensors
(R5) icbinpICantBelieveIts_seco.safetensors
(R6) lofi_v3.safetensors
(R7) yiffymix_V32.safetensors
(R8) fantexiV09beta_fantexiV09beta.ckpt
(R9) nightSkyYOZORAStyle_yozoraV1Origin.safetensors
(R10) braindance_BD071.safetensors
(R11) toonyou_beta6.safetensors
(R12) unstableinkdream_75Anime.safetensors
(R13) chikmix_V3.safetensors
(R14) epicrealism_pureEvolutionV5.safetensors
(R15) sdvn3Realart_origin.safetensors
(R16) dream2reality_v10.safetensors
(R17) manmaruMix_v20.safetensors
(R18) f222.safetensors
And here are the final results:
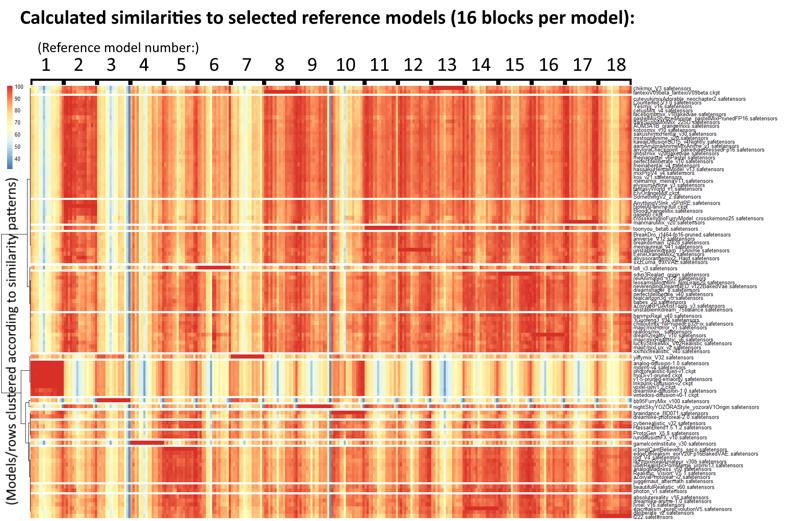
First a "heatmap", to show you how it can graphically display the similarity patterns, with every single block in every reference model (18x16 = 288 numbers/datapoints for each of the 100 models - one model per horizontal row/line) The clustering on this one used Pearson correlation and the "ward.D" algorithm:

(Civitai compressed the pasted image, but I uploaded the full resolution here:
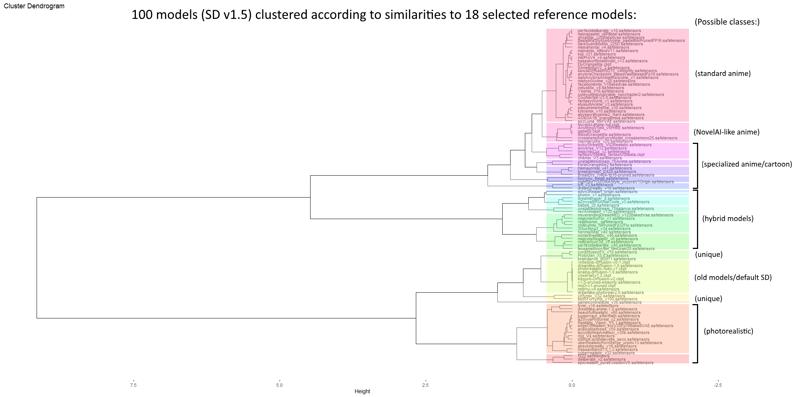
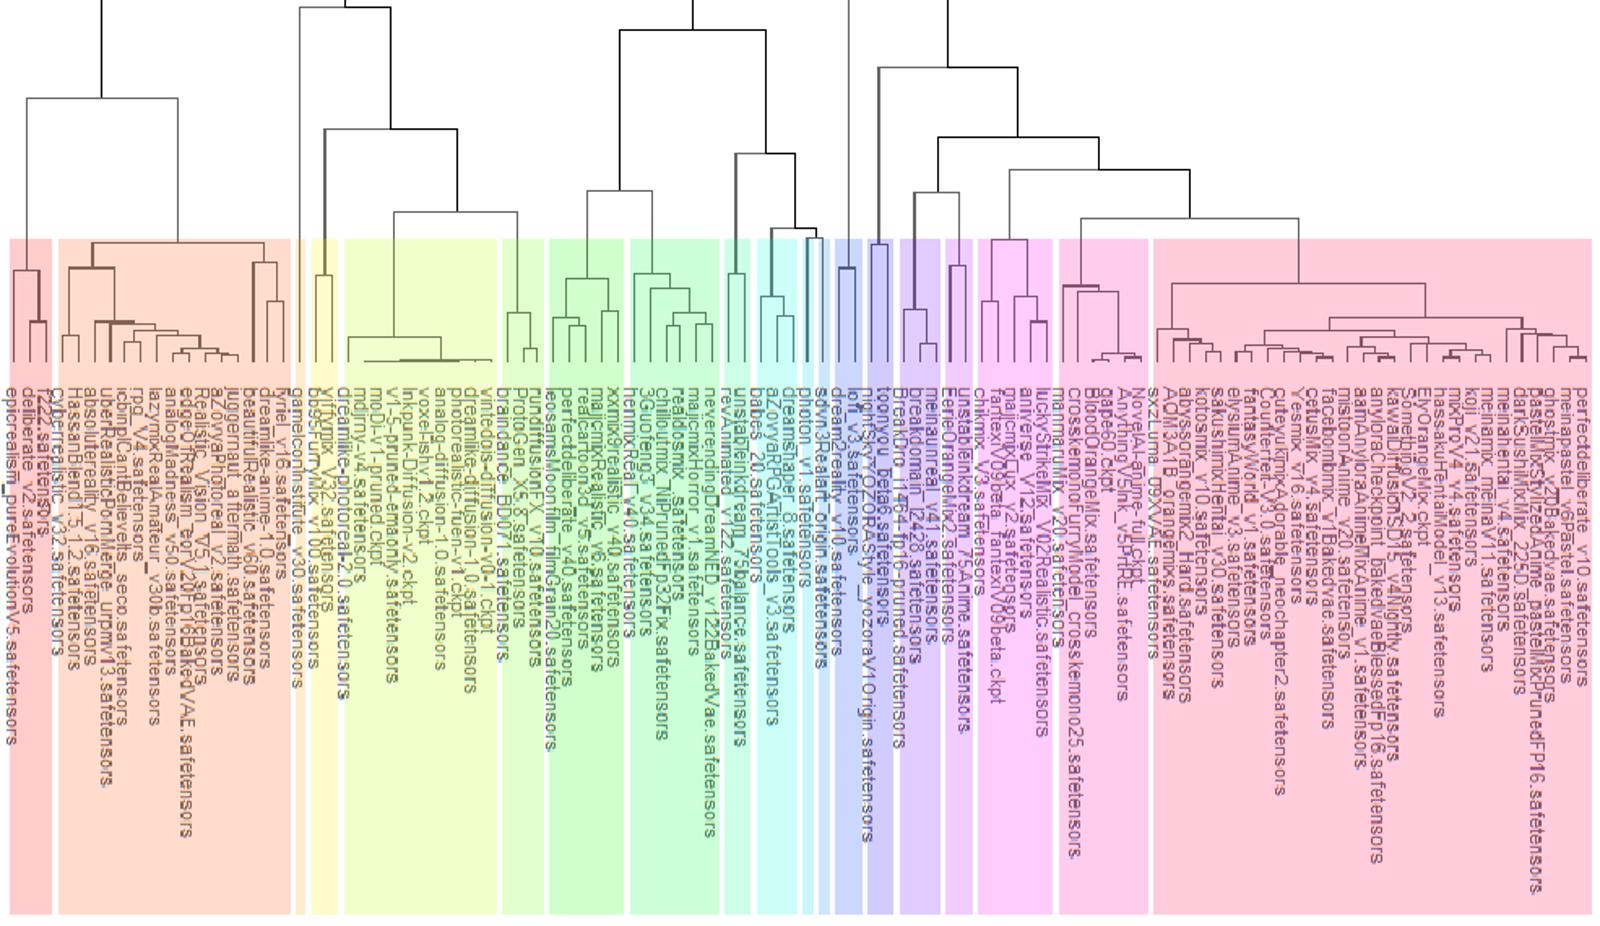
When run with some other RStudio functions it becomes more understandable, and graphically more pleasing. I found that 19 classes seems to make sense for this figure. this one used Pearson correlation and the "ward.D2" algorithm:

(Civitai compressed the pasted image, but I uploaded the full resolution here:
I have added some description on the right side to suggest what type of models each of the colored "class" boxes contain. Please bear in mind that I do not have extensive experience with every model (although I did run a few test-prompts with each), so feel free to comment on the results if you think some of the clustering differs from your own experience! Also a disclaimer: This figure only shows how the models behaved in my ASimilarity calculation test as described above, it is not a proof of direct relation between models (in the sense that one is necessarily a mix of the other). But models grouped close together in this figure do seem to have a lot more in common with each other than with most other models!
To conclude, I was pleased with the results because it shows it is possible to do this kind of classification (at least it made sense to me, but again feel free to comment and share your thoughts!). Also I found it interesting to see that some things I expected turned out to be true. For example a large number of anime models were grouped together in a big cluster... A few models are so different from anything else (like BB95FurryMix or GameIconInstitute) that they were hard to classify and ended up isolated or in very small groups.
If anyone is interested in the python code, feel free to look at it (I attached it but please know I am not a professional programmer so it's probably rather messy!). Also attached files: The Excel data, a list of the hashes of the 100 tested models, the python script used to create the hashlist, and the reference models list (textfile) I used.

