About
I just began to play with ComfyUI 1 week ago. As a programmer I'm taking a anatomical view of the code base to understand how things work. I hope this article is helpful to you if you are in similar situations as mine:
When an error message appears in ComfyUI, you want to know the root cause and fix bugs.
You want to step through the code to see how the workflow parts work under the hood.
My environment
Win11
ComfyUI windows portable | git repository
VSCode
Method 1 - Attach VSCode to debug server
This part is my exploration on a debugging method that applies to both local debugging (running ComfyUI program on my PC) and remote debugging (running ComfyUI program on a remote server and debugging from my PC).
Step 1: Run the server with debugger
Dragging run_nvidia_gpu.bat to notepad I saw it's simply invoking a python script like this
.\python_embeded\python.exe -s ComfyUI\main.py --windows-standalone-buildAt this point, my plan was to tweak this line to run the server with a debugging port, then to attach VSCode to this debug port. Firstly, I wanted to install debugpy which is documented with VSCode.
Simply installing debugpy by `python -m pip install --upgrade debugpy` didn't work because `.\python_embeded\python.exe` (a standalone python package used by the ComfyUI portable build) was not aware of the global python modules. So I did the trick by running the following command, which installs debugpy in the standlone folder:
.\python_embeded\python.exe -m pip install --upgrade debugpyThen I changed the line in run_nvidia_gpu.bat to
.\python_embeded\python.exe -s -m debugpy --listen 5678 --wait-for-client ComfyUI\main.py --windows-standalone-buildSaving the file and double clicking on the .bat to launch the server.
Step 2: Attach VSCode to the debug server
This is quite a standard process for debugging with IDE and I believe you can find a bunch of tutorials online, so I'm only noting some bullet points and problem solution here.
Use
Python:Remote AttachmodeGo through the config prompts for debugging. Use
localhostand the port of debug server (5678 in my case)
When setting breakpoints, I saw Breakpoint in file that does not exist . This is because my VSCode doesn't know the python script opened are being debugged though the debugging port.
After reading this github thread, I knew I need to configure the `remoteRoot` in the launch.json:
{
    // Use IntelliSense to learn about possible attributes.
    // Hover to view descriptions of existing attributes.
    // For more information, visit: https://go.microsoft.com/fwlink/?linkid=830387
    "version": "0.2.0",
    "configurations": [
        {
            "name": "Python: Remote Attach",
            "type": "python",
            "request": "attach",
            "connect": {
                "host": "localhost",
                "port": 5678
            },
            "pathMappings": [
                {
                    "localRoot": "${workspaceFolder}",
                    "remoteRoot": "${workspaceFolder}"
                }
            ],
            "justMyCode": true
        },
        {
            "name": "Python: Current File",
            "type": "python",
            "request": "launch",
            "program": "${file}",
            "console": "integratedTerminal",
            "justMyCode": true
        }
    ]
}
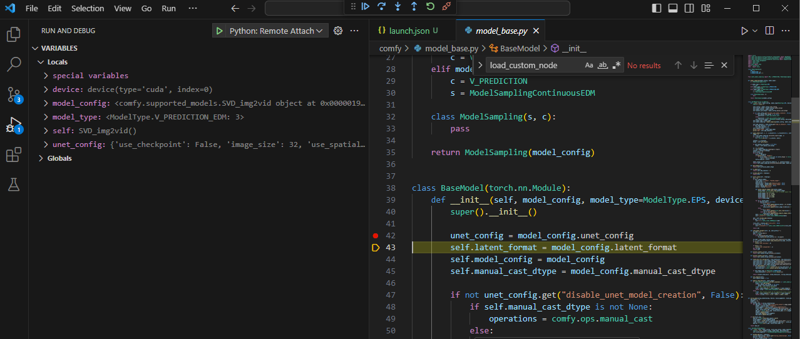
example of setting breakpoint and stepping through the model init method
Method 2 - Attach VSCode to the ComfyUI process
This method works for local debugging where I run ComfyUI standalone build and debug on my PC.
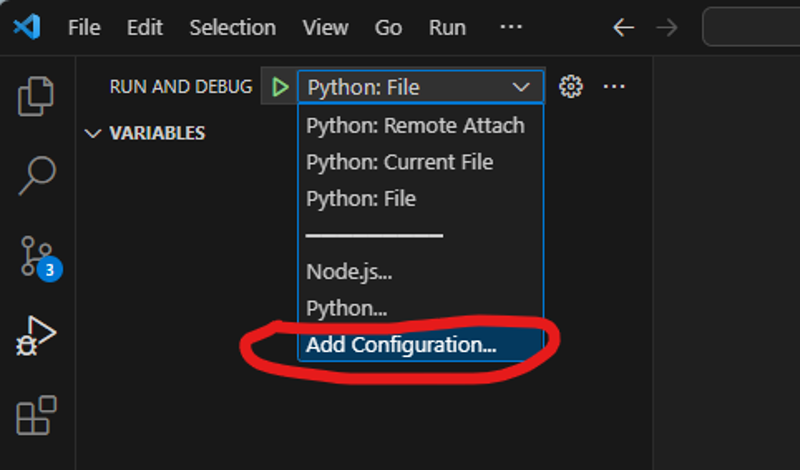
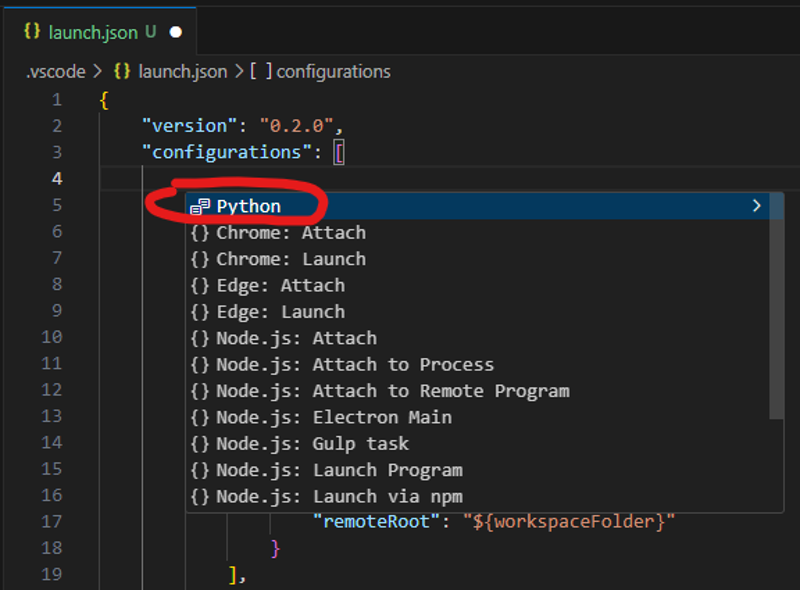
Step 1: Create a debug configuration
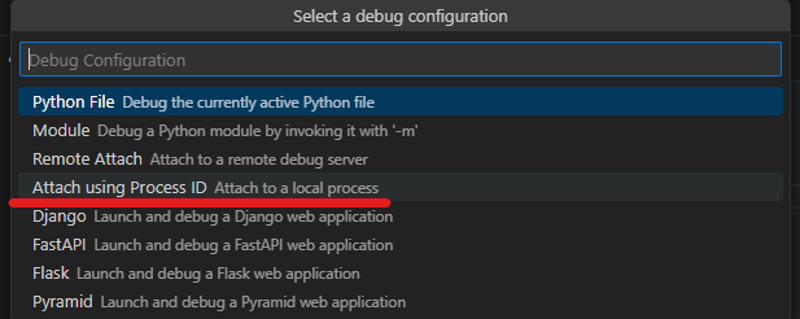
Create a debug configuration "Python: Attach using Process Id"


After adding this debug configuration my `launch.json` file shows a new config like this
        {
            "name": "Python: Attach using Process Id",
            "type": "python",
            "request": "attach",
            "processId": "${command:pickProcess}",
            "justMyCode": true
        },
Then I could run the debugger with this config:

Attach to the ComfyUI process:

Method 3 - Run and debug current file
VSCode provides another more direct configuration to run and debug the python code: "Python: Current File", but it uses the global python interpreter. Meanwhile the portable build has an embedded python interpreter, so method 2 should still be the easiest way to locally debug with the portable build.
However, it's much easier to use this config when working with the pulled ComfyUI git repository and no specific version of python interpreter is required. As I only need to navigate to the main.py and run the debugger from there:


