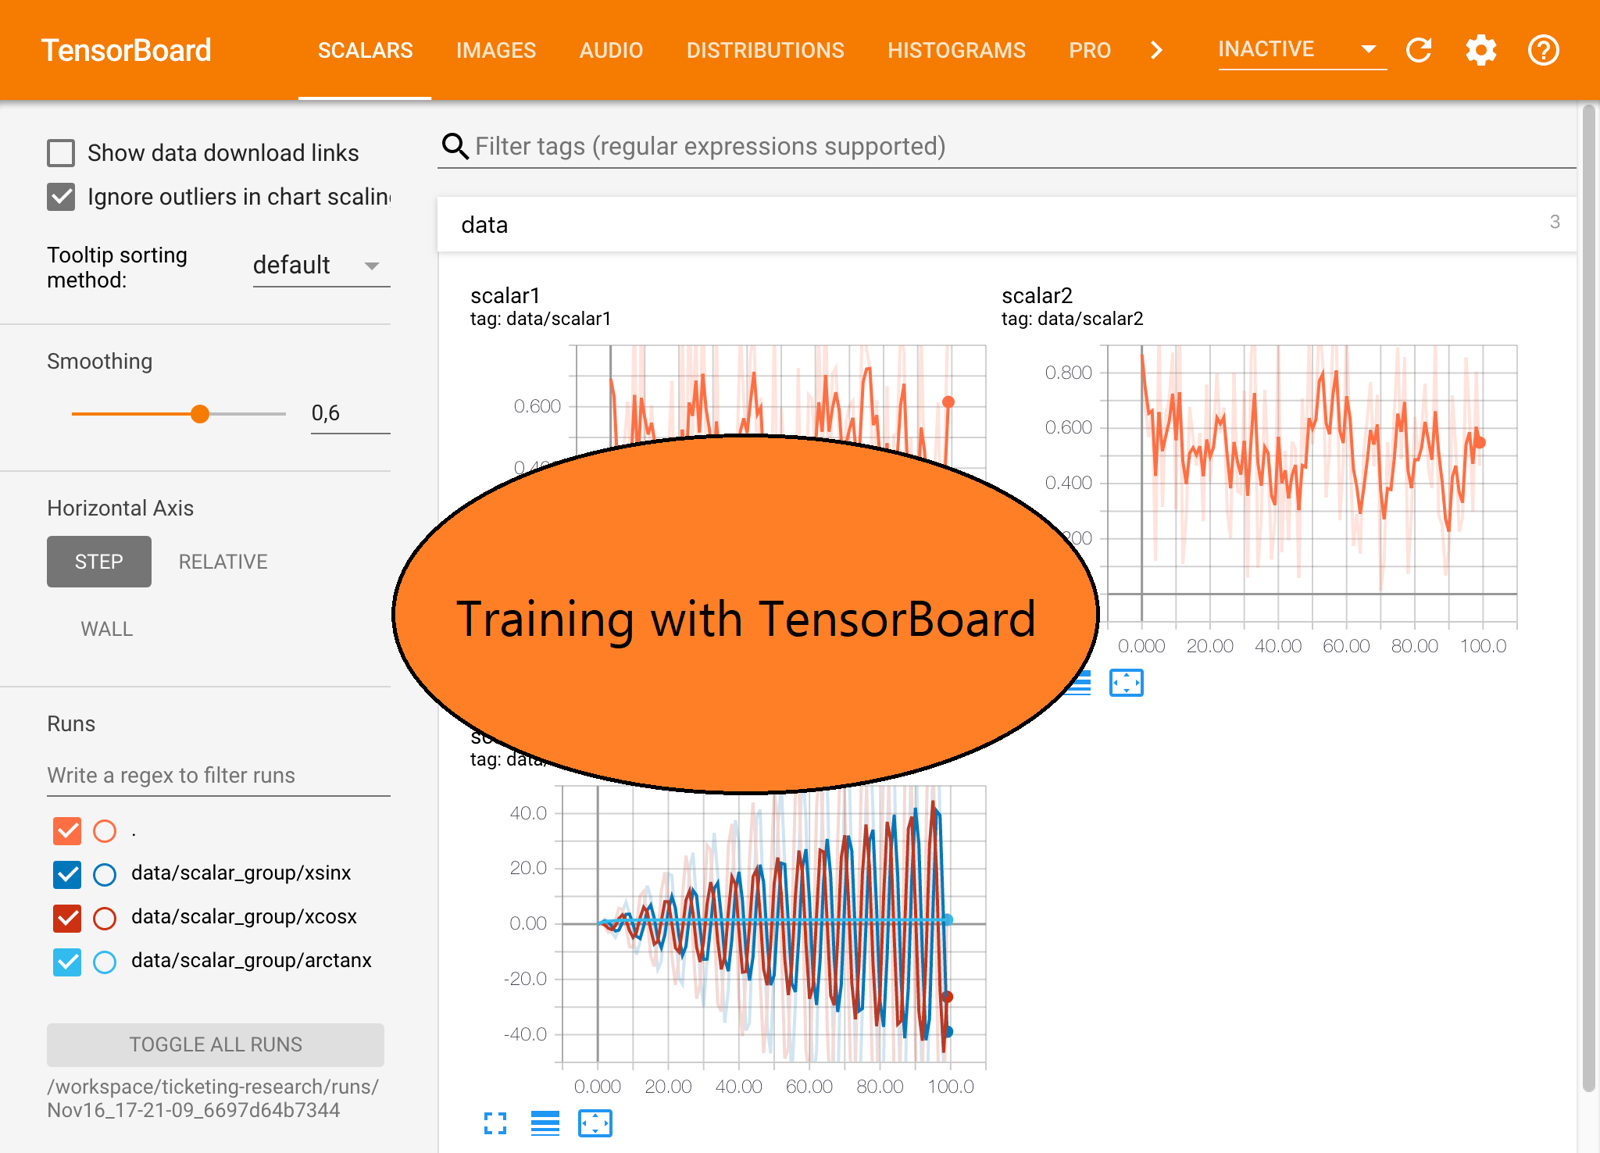
What is tensorboard?
Tensorboard is a free tool used for analyzing training runs. It can analyze many different kinds of machine learning logs.
This article assumes a basic familiarity with how to train a LoRA using Kohya_SS.
Why should I use tensorboard?
Tensorboard provides more information about your training methods. It is another tool to assist in learning how to fine-tune models.
Tensorboard speeds up the testing process by helping to cherrypick epochs that are well positioned on the graph.
Loss/epoch alone is not a sufficient metric to determine the best epoch. By visualizing the points of strongest convergence throughout a training run, it is possible to significantly reduce the effort required to evaluate many epochs.
Setup Instructions:
Start a terminal window and
pip install tensorboard. After installing, close the terminal window.optionally: also install tensorflow with
pip install tensorflowThis is not needed, but silences an error when startingtensorboard.
Start
kohya_ss. Make sure to set theLogging folderinkohya_ssfolders tab. I prefer to set it to the same value as theOutput folder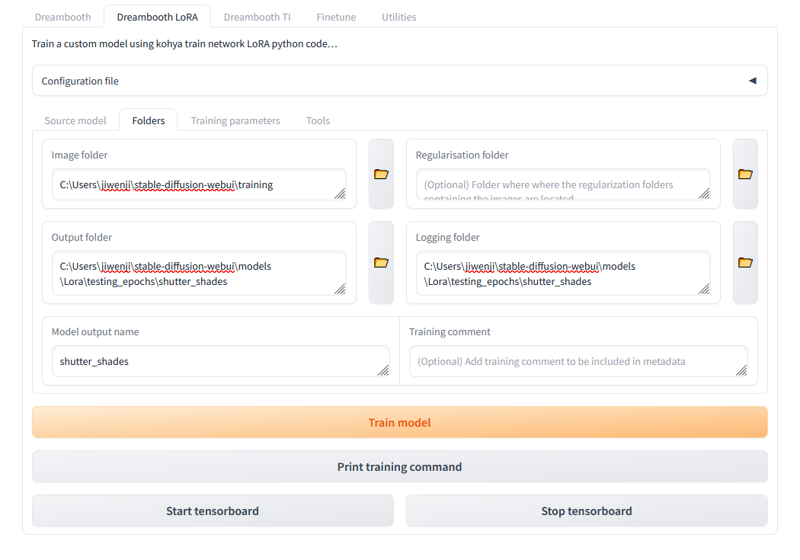
Set the rest of the training parameters. Recommend no more than 10 repeats per epoch to ensure sufficient sample data is generated.
Start the training run.
Open a new terminal window and
cdto theLogging folderfrom step 2.cd C:\Users\jiwenji\stable-diffusion-webui\models\Lora\testing_epochs\shutter_shades
run
tensorboard --logdir .to start tensorboard in the current directory. You can also put a path instead of.
Open a browser tab at
http://localhost:6006/#timeseriesAs the training progresses, the graph is filled with the logging data. You can set it to update automatically in the settings.
What is all this data? - analyzing a log
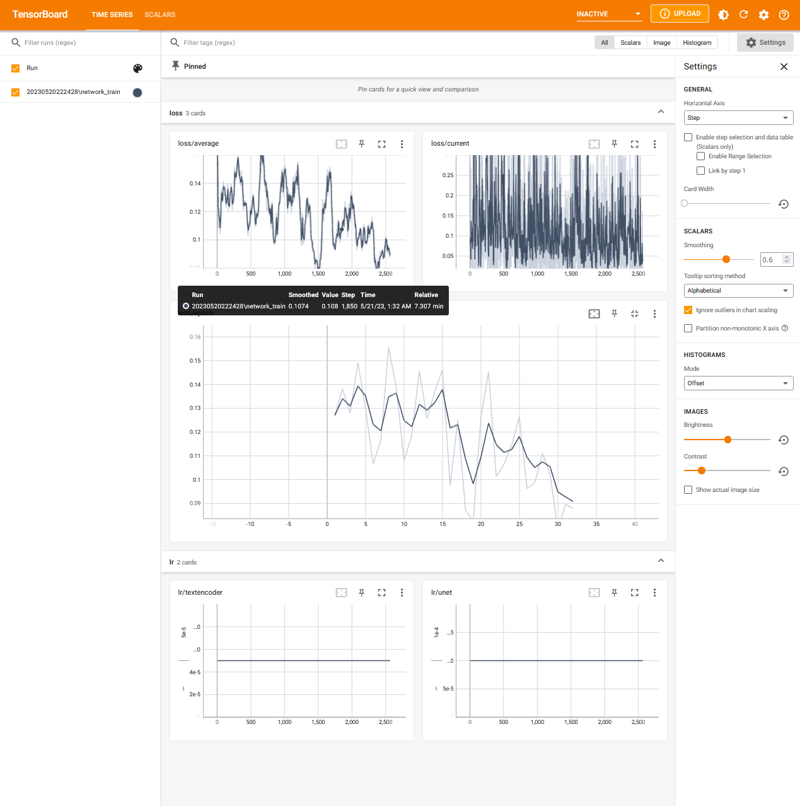
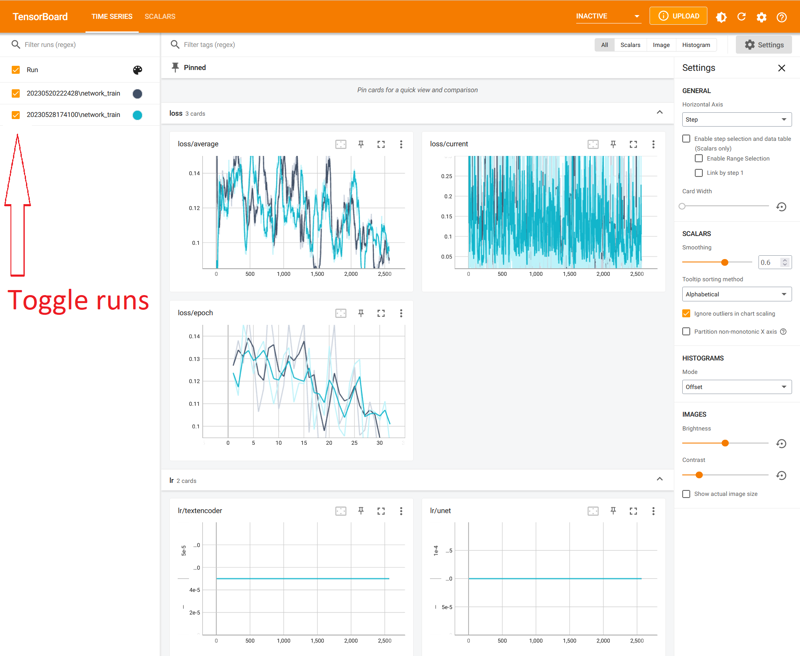
The most important graph is loss/epoch. Here you can inspect how the loss/epoch descends over time with more training. The logging data here was used in the creation of v2.0 of shutter shades.
There were 16 training images and 5 repeats per epoch, using constant scheduler. Instead of testing various prompts against all 30 epochs, the tensorboard graph suggests the best epochs for testing.
With this loss/epoch graph, first test epochs 7, 11, 16, 19, and 30, as the epochs with progressively lower loss rates throughout the training run. There wasn't meaningful loss between epochs 7, 11, 16, but decided to test anyways to get a better feel for how the training was progressing.
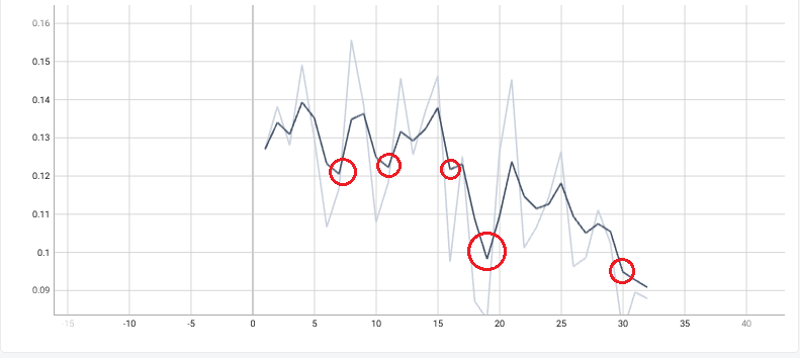
In my experience, the best epochs have loss rates ranging between
0.10 - 0.13, with values below0.10tending to be overtrained and above0.13as undertrained, however your results may vary.
Look at the results from the individual epochs by generating images in AUTOMATIC1111 or your preferred Stable Diffusion UI.
Among the first set [7,11,16,19,30], epoch 19 has the best quality. Then test adjacent epochs [17, 18, 19, 20, 21]. After careful consideration, we released epoch 18.
Trust your eyes! This tool does not replace visual inspection.
Keep it running!
If you start another training run with the same output directory, it will render both graphs at once. You can toggle the graph for a run on/off in the sidebars.
Otherwise, press CTRL+C to stop the tensorboard server.
What's next?
Now that you've trained a model, learn some of the additional techniques for generation!


