Introduction
The realm of image generation has been transformed by diffusion models like FLUX, which excel at creating high-quality, detailed images. A significant enhancement to these models is the integration of Low-Rank Adaptations (LoRA), a technique that allows for efficient fine-tuning without the need to retrain massive networks from scratch.
LoRA is a method designed to adapt large neural networks efficiently by introducing trainable rank decomposition matrices into existing layers. Instead of updating all the parameters of a pre-trained model, LoRA focuses on injecting small, low-rank updates that require significantly fewer resources. This approach is particularly beneficial for large models where full fine-tuning would be computationally expensive.
In the context of the FLUX diffusion model, a LoRA is applied at the block level within the model's architecture. Specifically, FLUX LoRAs utilizes 19 Double Blocks and 38 Single Blocks with an additional input layer at the beginning. During LoRA training not all blocks are trained equally, depending on the concepts that is trained different blocks are trained more the others. Isolating these blocks and the only train them alone would result in a significant file size reduction, which allows higher network dim at reasonable filesizes and thus a high level in detail and quality.
This guide explains the use of my workflow to test the impact of LoRA Blocks for FLUX.
The Workflow

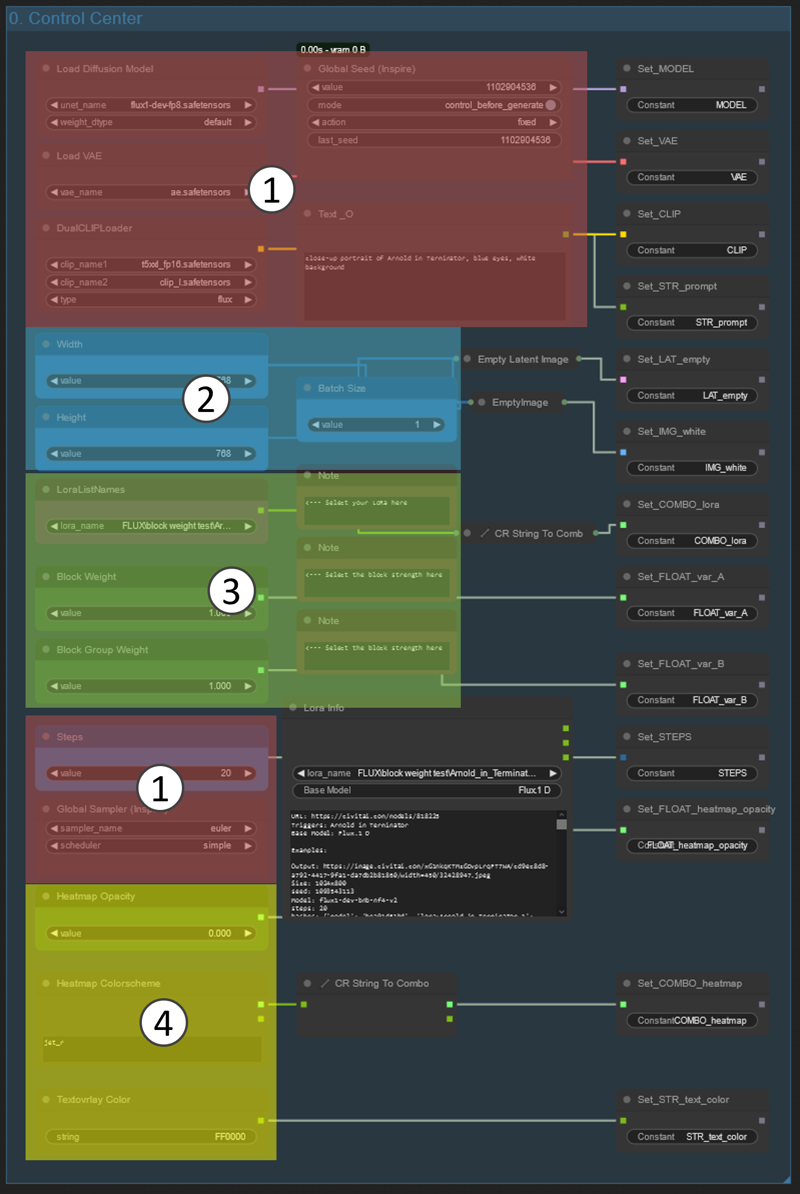
In area1, the control center, most of the settings are configured and models are loaded. This is where you can adjust settings and load the necessary models.
Moving on to area2, the image generation area, which is pretty self-explanatory. This is where the images for each lora block are generated based on the models and settings you've selected.
Next is area3, the images display area, also self-explanatory. Here, you can view the images that have been generated.
In area4, the image export area, all images are combined into one big image for later reference. This allows you to export and save your results conveniently.
Finally, area5 is the manual testing area, where you have the possibility to compare different block combinations and observe their effects in detail.
The Control Center

In area1, you load the model, add the prompt and set other basic parameters
Next is area2, here you select the image and batch size. Keep in mind that your generate about 60 images to get a full set. At 768x768 and batch size 1 it takes about 30-40min on a 3090ti.
In area3 you select the lora and can set the block weight during image generation. I recommend you leave it at 1. Keep in mind that changing this value will require all images to be generated again.
Finally, area4 you can adjust the transparency and coloring of the heatmap and text overlay.
Usage

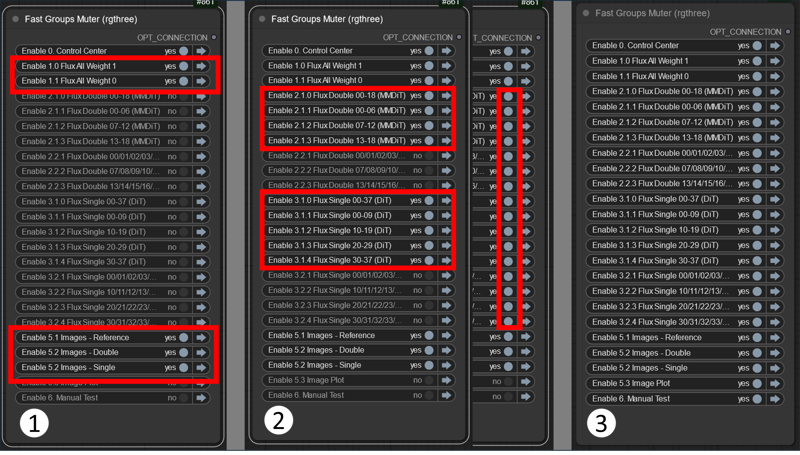
1. Switch on Group 1.0 and 1.1 and start the workflow. This will generate 2 reference images. One without the LoRA and one with the LoRA with all blocks on, as it was trained.
Keep generation reference image and adjust the prompt until you get something that allows you to evaluate the effect of the LoRA.
You can switch on the image area now or in step 2.
2. Now switch on the block groups you want to generate either do it individually or all at once, it is up to you.
3. Once you generated a full set of image you can use group 5.3 to generate a plot of all images to save for later reference. Beware that these images can get quite big depending on you image and batch size.
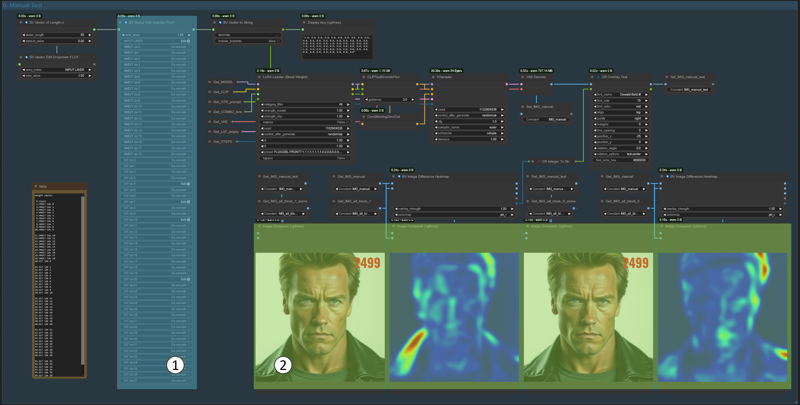
You can also use group 6. to test different block combination and evaluate the effect in detail by comparing the result to the reference images.
You also can just use 6. without generating a full set of images, but you need to generate the reference images (Group 1.0 and 1.1)
Manual Testing

Here you can play around by switching on and off individual blocks in area1 the generated image can be compared to both reference images in area2.
Remark on Heat-map and Scoring
The heat-map shows the pixel by pixel difference based on the colour values of each image compared to the reference image without LoRA or vanilla Flux. In my examples red areas mean the biggest difference while blue means little to no difference. The heat-map does not evaluate the quality or reason of the difference only it presents. You need to evaluate this yourself. Also currently the heat-maps colour gradient is scaled for each map individually and thus is not comparable across images.
For this the Mean Squared Error (MSE) between an image and reference image without LoRA is shown in the top-right corner. The maximum MSE roughly 65000 when comparing a black and white image. So a high value means a more different image, but again it gives no indication on the rootcause or locations of the difference.
I will try and improve this system in the future, but for now please both the heat-map and MSE value together to aid your judgement on which blocks have the most influence.
Special Thanks
Special Thanks go to BlackVortex for making customfit comfyui nodes that significantly improve this workflow.
Special Thanks go to denrakeiw on who's workflow this workflow is based on
Special Thanks go also to the community on the KiWelten Discord Channel.
Join us at: https://discord.gg/pAz4Bt3rqb
Lastly please share your findings and post your results to the workflow gallery so other people can reference them
Examples
Celebrity
link to image post / link to LoRA


link to image post / link to LoRA


Character
link to image post / link to LoRA


Car
link to image post / link to LoRA


Armor
link to image post / link to LoRA


